
General Actions:


DevForce Resource Center » Development guide » Test, log, and debug » DevForce Fiddler debugger extension
Last modified on August 30, 2013 16:19
A Fiddler extension to inspect network traffic in an n-tier DevForce application.
DevForce sends compressed binary messages between the EntityManager and the EntityServer. You can use this extension to inspect these messages, to help when debugging your n-tier and Silverlight applications.
- Platform: N/A
- Language: C#
- Download:
- DevForce Fiddler Extension (binary)
- DevForce Fiddler Extension (source)
- Fiddler
Usage
- Unzip the DevForceFiddlerExtensionbin.zip file and drop the DevForceFiddlerExtension.dll into the appropriate Fiddler2\Inspectors folder:
32-bit System: %PROGRAMFILES%\Fiddler2\Inspectors
64-bit System: %PROGRAMFILES(x86)%\Fiddler2\Inspectors - Launch Fiddler2.
- Run the application you're watching. If the EntityServer is running on LocalHost, see tip below.
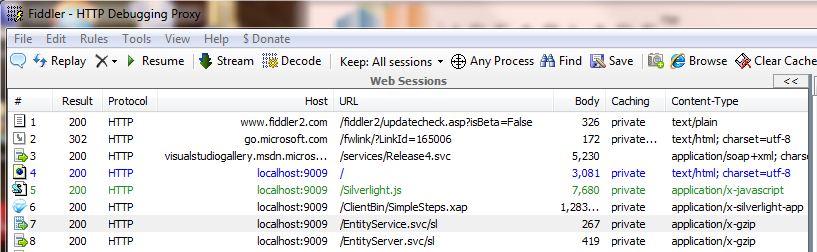
- Select the Web Session you want to inspect. The URL of such sessions typically begins "/EntityServer.svc/...".
Tip: If watching a browser session, you can drag the target icon from the Fiddler tool bar onto that browser; this will filter "web session" traffic to just that browser. Click the target icon again to remove the filter. - Select the Inspectors tab in the right pane.
- Among Inspectors, select the Raw sub-tab of either the Request or Response pane. Notice that the material below the headers is unreadable. The payload is formatted as compressed binary in DevForce.
- Among Inspectors, select the DevForce sub-tab. The DevForce inspector reformats that payload as readable XML. Below we see request and response snippets from a query (or Fetch operation in DevForce):
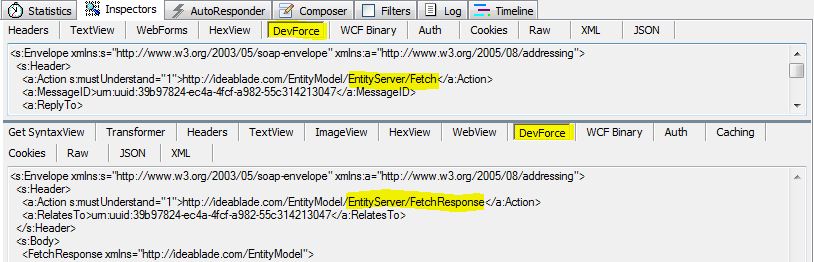
- The messages will seem overwhelming at first, since you'll see the entire WCF envelope and all the metadata DevForce passes with a message. Once familiar with the message format, you'll be able to inspect what is passed between the client application and server.
Regarding traffic sent to http://localhost or http://127.0.0.1
Internet Explorer and the .NET Framework are hardcoded not to send requests for Localhost through any proxies, and as a proxy, Fiddler will not receive such traffic.
Update: This behavior was changed for Internet Explorer 9. IE9 allows Fiddler to proxy traffic sent to localhost or 127.0.0.1 without additional steps on your part.
For non-browser based client applications, you'll need to use a workaround.
The simplest workaround is to use "localhost.fiddler" as the hostname. This also works when sending traffic to IIS Express, which by default will only listen for the "localhost" hostname. You can make this change in your app.config. For example:
| C# | <objectServer remoteBaseURL="http://localhost.fiddler" serverPort="nnnn" serviceName="EntityService.svc"> <clientSettings isDistributed="true"/> </objectServer> |
If you're not using IIS Express, other workarounds are available too. See here for more information.
Note: You shouldn't ever encounter the "Localhost traffic not captured" problem with Firefox. The FiddlerHook add-on for Firefox removes "localhost" from the "bypass proxy" list when Fiddler is in "Capturing" mode.
Learn more
Documentation for building custom extensions, like this one, can be found here. The source code for the DevForceFiddlerExtension is available for download from the link above. You can modify it to suit your needs.