
General Actions:


DevForce Resource Center » Development guide » Test, log, and debug » Debug » Understand logged info
Last modified on September 18, 2012 10:36
Contents
The messages in the debug log may at first look obscure to you, but once you understand what's being written, when, and why, they can often help in diagnosing problems. Understanding "normal" activity is also important, so you know what to look for when something does go wrong.
Most interesting tracing messages from DevForce are generated at start up. At initialization the IdeaBladeConfig.Instance is loaded, "probing" occurs, and service communication is initiated. It's during this time that DevForce does most of its logging about how the application is configured, and here where you'll find the most useful diagnostic information.
Once processing is underway, DevForce performs little logging of its own actions. Custom trace and debug messages generated from your application will usually help in understanding your standard processing and any errors or unexpected situations.
In reading through a log you'll notice that messages aren't always sequential, particularly in the server log. This is because logged actions can occur on different threads, often concurrently, and is usually not a cause for concern.
Discovery Part 1
Let's look at discovery, or probing, first.
DevForce uses MEF (the Managed Extensibility Framework) to provide extensibility. One of the first actions performed is to find the default and custom implementations of various interfaces and base classes. The default implementations are found in the DevForce assemblies - for example, if you haven't implemented a custom IEntityLoginManager, we'll fall back to using one of our defaults.
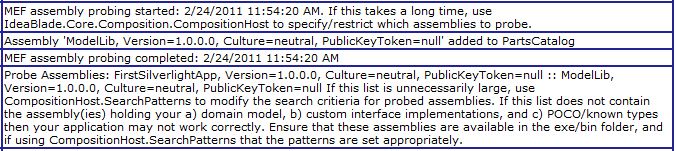
The first message shows the time probing started and a helpful reminder: if the timestamps showing when probing starts and completes indicate the process is taking too long, see the Extend topic for information on how to control this.
The second message tells us that one of our assemblies was added to the "parts" catalog. In this application several custom interface implementations are defined in the assembly listed, so it's a good bet that our implementations have been found and will be used when needed. If you've implemented any custom implementations and don't see one or more messages about the assemblies being added to the parts catalog, then stop and figure out why; maybe the assemblies weren't found. If an assembly couldn't be loaded you'll also find that message here: an assembly load failure is usually due to missing references.
Finally we see when probing completed, and all the assemblies DevForce found. It's worth examining this list for two reasons: 1) if the list contains a lot of assemblies it's likely the whole probing process is taking too long and also likely that DevForce really does not need to know about every assembly; and 2) if the list does not contain an assembly that it should then the application will likely experience a failure later. DevForce needs to find any assembly containing your model(s) and your custom implementations and known types, but other assemblies are usually superfluous and will slow down the initialization process. To fix this, see the Extend topic.
License
Next, the all-important license message:

Why is this important? If the license information is not found the application won't run at all. If the license information is incorrect, then functionality may be reduced. It's common when upgrading your license - say from Express to Universal - that you've neglected to re-generate the code for your entity model. At run time DevForce uses the license found in the entity model to determine the functionality provided. If you see in the log that the wrong license was found, first re-generate your model code and try again. (By "re-generate" we mean only to either open the EDM Designer and save, or select "run custom tool" for the .tt file - it's the designer code file which must be re-generated.)
You'll also see a message (not shown here) about whether a "session-agnostic load balancing" license was found. If you have a Data Center license then load balancing support should be enabled.
Housekeeping
Now for some housekeeping. You'll see somewhat different messages in different environments, here we show the EntityServer (hosted in the ASP.NET development server) and Silverlight.
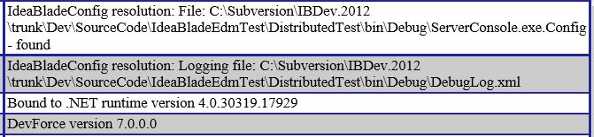
Entity Server -
Silverlight (note that a trace viewer was used to capture these messages) -
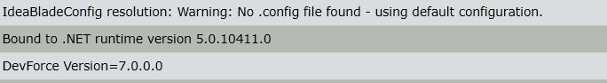
The messages will show how the IdeaBladeConfig was loaded. It's generally loaded from an ideablade.configuration section found in a .config file (but you can also initialize it in code). For the EntityServer we see that the section was found in the web.config file, while in Silverlight we see that an app.config was not found and the default configuration will be used. Since an app.config is generally not needed in a Silverlight application this is standard. For any environment, if an error message is logged that the configuration was found but failed to load, ensure that the xml of the .config is correct.
The DevForce version is logged next. Simple, you think. But we've found that it's very easy after a DevForce upgrade to re-compile and/or re-deploy the wrong assemblies, or have the client assemblies at one version and the server assemblies at another. The DevForce version must be the version you expect, and the version must be the same on both client and server.
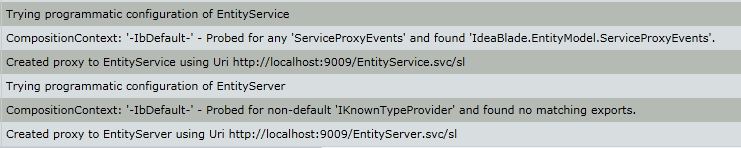
Communications
Next, the service/proxy start up information is logged. This information will be different on client and server, since on the server the WCF services are started, while on the client proxies to these services are created.
Remember that a single EntityService service is started, and then an EntityServer service for each data source extension and composition context. If you're not using either data source extensions or composition contexts, then you'll have only a single EntityServer. Note that there will be some intervening messages not shown here.
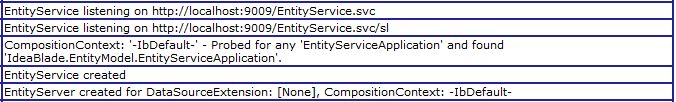

What we see here are the services starting and the endpoint addresses on which the services listen. In this case we see two endpoints for each service. This is because DevForce will automatically add an endpoint based on the SupportedClientApplicationType setting. This setting defaults to "UseLicense", which means that DevForce will create endpoints for whatever the license allows. In this sample we're using a Universal license, and endpoints were created for both Silverlight and non-Silverlight clients. Why does Silverlight need its own endpoints? The communication setup and error handling are a bit different.
| XML | <serverSettings supportedClientApplicationType="UseLicense" /> |
Here's the communication start up for a Silverlight client:
We see that proxies were created for the Silverlight endpoint addresses we saw above.
Communication failures are the most common type of initialization problem. Life would be easy if the cause of every communication failure was neatly written in the logs, but this is often not the case. Error messages from caught exceptions will be logged, but if a service cannot be started this can often not be logged, so using other debugging techniques may be needed. The failure of a service to start is usually caused by an IIS compilation failure or a configuration problem, and is not logged because the application and DevForce never start. Also, if you see a mismatch between the service endpoint addresses and the addresses the client is trying to use, that's always a good indication of why communications are failing.
Discovery Part 2
Scattered throughout the log file we'll also see messages from the CompositionHost, issued when an interface or base class extensibility point is encountered. Generally these messages are generated the first time something is probed for, but in some cases you'll see a message for every attempt.
For any of your custom implementations you need to check that it was found and used. When not found DevForce will generally use the default implementation, and your application may not work as wanted.
A message such as the following:

... indicates that DevForce is looking for a custom implementation but didn't find one, while the message below:

... indicates that DevForce is looking for any custom or default implementation and has found the default.
Below we see a message when our custom implementation was found:

It's good practice to check the logs, on both client and server, to ensure that all your custom implementations have been found and used. Remember that different extensibility types may be probed for on client and server: for example the IEntityLoginManager should be on the server only, while a ServiceProxyEvents implementation would be on the client only.
Login
Login information won't be recorded until the first user tries to log in. At that time, DevForce will search for an IEntityLoginManager, and record other information about the authentication environment.
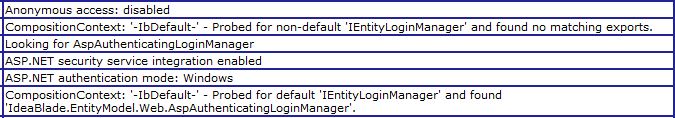
Above we see that ASP.NET Windows security has been enabled, guest access disabled, and the standard DevForce ASP.NET login manager is in use.
After the first login, further information on client logins will not be recorded by DevForce. A custom login implementation may want to record when users log in or out.
Fetch and save processing
Some information will be logged for every query which will go to the data source (note you will not see these messages in the client log). This isn't the SQL for the query, but a simple string representation of the EntityQuery.

The first time an entity is encountered for a specific data source, this information will be logged too. The DataSourceKey must be resolved - through either the connectionStrings, EdmKeys or code - and the EF metadata found. You'll see either a message that the key was resolved, or an error concerning the connection string or metadata.
Generally, little information is logged for save processing unless an error occurs. You'll see probing messages for the EntityServerSaveInterceptor and several other types, but no specific information is recorded about each save.
Exceptions
On the server, most exceptions are caught and written to the log in their entirety, so checking the server log for exceptions is usually a good idea. All exceptions occurring during a save will be logged in the server's log: these exceptions often indicate "normal" processing, for example concurrency errors. The default EntityServerErrorInterceptor will also log all exception text for any unhandled error to the server log.