
General Actions:


Last modified on March 31, 2016 14:59
Contents
The debug log is a historical record of an application's activities: it always starts when the application starts, and is continuously appended to. But DevForce also provides several "trace viewers", components which provide a real-time view of tracing as it occurs.
A trace viewer can be started and stopped at any time, run as a standalone utility or as part of your application, and view tracing messages from different sources.
Before we launch into a discussion of the trace viewer utilities we need to take a slight detour and discuss trace "publishing" to help understand how a viewer works and what it can view.
Trace publishing
Trace and debug activity within a DevForce application uses the "publish-subscribe" metaphor: messages are always published, and any number of subscribers may listen in. This publishing is generally local to the application itself and a subscriber will listen only for its own activity.
These messages can also be broadcast, or published, as part of a "trace publisher" service, to make the messages available to remote subscribers. (For those interested, the publisher is a WCF service.) By default, the console and Windows Service versions of the server (ServerConsole.exe and ServerService.exe) publish their messages. In a web application, the service can be started by calling the following, generally in the global.asax:
| C# | IdeaBlade.Core.TracePublisher.LocalInstance.MakeRemotable(); |
| VB | IdeaBlade.Core.TracePublisher.LocalInstance.MakeRemotable() |
A client application can also publish its trace activity, using the same technique.
As a service, the publisher must have a name and port. The default address in DevForce is net.tcp://localhost:9922/TracePublisher: where net.tcp is the protocol, 9922 is the port, and TracePublisher is the service name.
Remember the logging element in the ideablade.configuration? Now we see where some of the "advanced" properties come into play:
| C# | label="XML"}} <logging logFile="DevForceDebugLog.xml" port="9922" serviceName="TracePublisher" /> |
Both port and serviceName can be modified to override the defaults. You can also override the defaults when calling MakeRemotable, passing a port number and service name.
Why change the defaults? If multiple applications or services will be publishing trace messages on the same machine, you must change either the port or service name in order to provide a unique URL.
Now back to the trace viewers. They will "subscribe" to a publisher to view its messages. That publisher is usually a service as described above, but it can also be the local publisher.
Trace viewer in Silverlight
A debug log is not generated for a Silverlight client application but tracing and debugging messages are still generated. You can listen for these messages with a custom ITraceLogger, and you can also use a simple trace viewer user control sample we provide. The sample viewer, when "dropped" into an existing window, provides a simple real-time display of tracing and debugging messages generated on the client.
Note that messages from the server will not be shown by this viewer.
Trace viewer utility
To use a trace viewer as a standalone executable subscribed to a remote publisher, launch the executable WPFTraceViewer.exe. As you might guess from the name, this is a WPF implementation of a viewer with basic functionality. The utility can be found in the Tools sub-folder of the DevForce installation. The WPFToolkit assembly is needed to run the WPFTraceViewer utilty. To download the toolkit see wpf.codeplex.com.
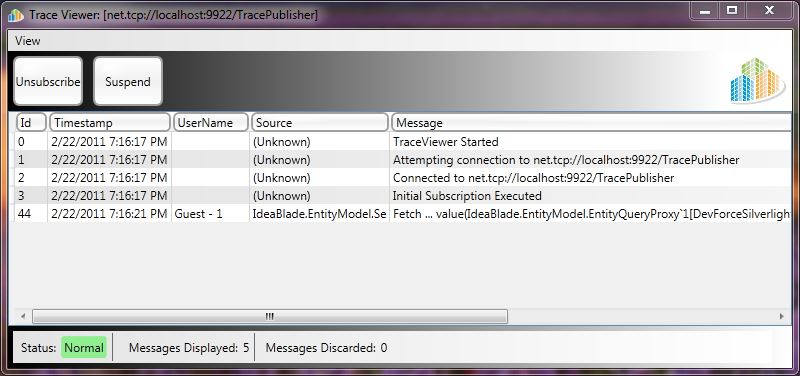
By default the trace viewer will attempt to subscribe to the well-known address mentioned above: net.tcp://localhost:9922/TracePublisher. You can, however, subscribe to (and unsubscribe from) any publisher.
The WPFTraceViewer also accepts a command line argument for the URL of the publisher, for example:
wpftraceviewer.exe "net.tcp://localhost:9001/mypublisher"
Using a trace viewer in your application
You can also use a trace viewer directly in your Windows application, with the viewer opened as a new window.
To do so, add a reference to WPFTraceViewer.exe to your UI project. For example, right-click the references node in your desired UI project, and select Add Reference. On the Add Reference dialog, select the Browse tab, then browse to the file and click OK.
To launch the WPF viewer:
| C# | IdeaBlade.DevTools.WPFTraceViewer.WPFTraceViewer tv = new IdeaBlade.DevTools.WPFTraceViewer.WPFTraceViewer(); tv.Show(); |
| VB | Dim tv As New IdeaBlade.DevTools.WPFTraceViewer.WPFTraceViewer() tv.Show() |
Constuctor overloads allow the trace publisher URL to be specified, but by default the viewer will subscribe to the local publisher in the application.
To see this in action see WPF Trace Viewer code sample.