
General Actions:


Page Actions:
Next »Configuration and deployment code samples
Up
Test, log and debug code samples
« PreviousCode sample: Trace viewer (Silverlight)
DevForce Resource Center » Samples » Test, log and debug code samples » Code sample: Trace viewer (WPF)
Last modified on September 20, 2012 11:16
You can use one of the DevForce trace viewers for a "real time" display of trace messages in your application. In this sample we show how to use the WPF trace viewer.
- Platform: WPF
- Language: C#, VB
- Download: WPF trace viewer
Problem
By default DevForce writes its trace messages to a file, generally referred to as the debuglog. The log file is a great tool for post-mortem analysis, but if you'd also like to see the trace messages as they happen, one of the DevForce-provided trace viewers can help.
Solution
The DevForce installation includes the WpfTraceViewer.exe utility in the Tools subfolder. There's another trace viewer for Silverlight applications.
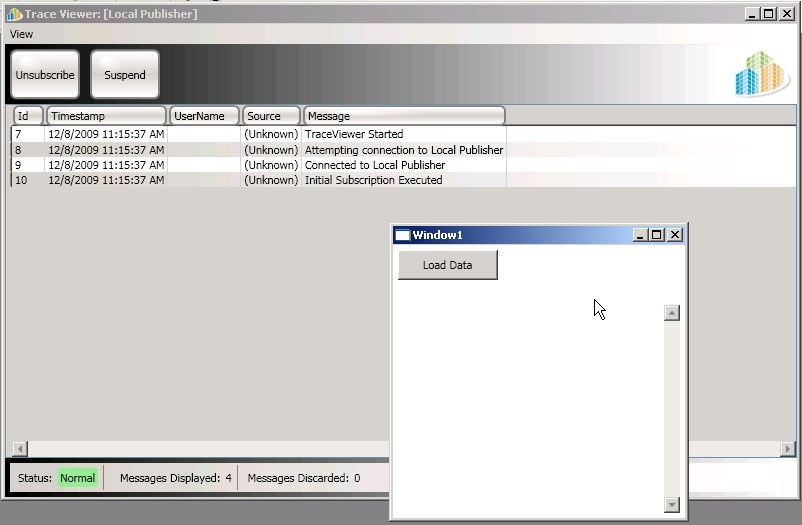
The sample shows a very simple WPF application, which displays the WPF Trace Viewer window at startup. You'll see tracing messages displayed as the application initializes.
Then click the Load Data button on the main form to see the log entries written as a by-product of the data retrieval operation.
Created by DevForce on July 14, 2010 16:40
Navigation
- Getting started
- Core concepts
- Development guide
- Model
- Create the entity data model
- Generate model code
- Customize the model
- Code First
- Write entities Code First
- Add a custom EntityManager
- Add a custom DbContext
- Generate metadata
- Set the database connection
- EntityAspect in Code First
- Custom entity base classes
- DevForce entity interfaces
- Generate the initial Code First model
- Troubleshooting Code First
- Advanced database connections
- Code First code snippets
- Code First vs. Database First
- Code sample: Code First Walk (WPF)
- Code First: AOP (aspect-oriented programming)
- Client models
- Property interceptors
- Attribute interception
- Define an interceptor to act against multiple types
- Dynamic property interception and the PropertyInterceptorManager
- EntityProperties and property interceptors
- Interception method signatures
- Interceptor chaining and ordering
- Multiple attributes on a single interceptor action
- Named vs. unnamed interceptor actions
- Property interception mechanics
- PropertyInterceptor attribute discovery
- PropertyInterceptor keys
- PropertyInterceptorArgs and IPropertyInterceptorArgs
- The EntityPropertyNames class
- Examine model metadata
- XML serialization of entities
- Separate the model project
- Subordinate entities of a root entity
- Use Enum types
- Use spatial types
- Working with EF 6
- Code samples
- Query
- Query using LINQ
- Query without using LINQ
- Query asynchronously
- Control query execution
- Cache a query
- Secure the query with attributes
- Query lifecycle
- Query using property navigation
- Build queries dynamically
- Add a named query
- Cache only queries
- Requery
- Useful query extension methods
- Improve query performance
- Code samples
- Display
- Create, modify and delete
- Validate
- Validation concepts
- Overview
- Generate automatic validation attributes
- Add custom validation attributes
- Consider predefined verifiers
- Create a custom verifier
- Configure a verifier
- Discover verifiers
- Perform a validation
- Intercept a validation
- Display validation results
- Validate on the server
- Localize error messages
- Code samples
- Save
- Secure
- Test, log, and debug
- Configure and deploy
- Take offline
- Extend
- Additional techniques
- Model
- Samples
- NorthwindIB Database
- Core concept code samples
- Code sample: DevForce Silverlight tour
- Code sample: DevForce WPF tour
- Code sample: DevForce Windows Universal app tour
- Code sample: DevForce Windows Store app tour
- Code sample: DevForce Windows Phone app tour
- Code sample: Simple Silverlight application (Silverlight)
- Code sample: Separate model projects (Silverlight)
- Code sample: Hello DevForce (n-tier WPF)
- Model code samples
- Code sample: Code First AOP
- Code sample: DevForce Windows Store app tour (Code First)
- Code sample: DevForce Windows Phone app tour (Code First)
- Code sample: Property interceptors (Silverlight) (WPF)
- Code sample: Working with multiple models (Silverlight)
- Code sample: WinForms walkthrough (WinForms)
- Coping with large models and large databases
- Code sample: Code First Walkthrough (WPF)
- Code sample: Code First Walkthrough: From New Project to Running
- Code sample: Code First Walkthrough: Update the Model and Bind to it
- Code sample: Code First Walkthrough: Explicit Entity Mapping
- Code sample: Code First Walkthrough: Validation and Property Interception
- Code sample: Code First Walkthrough: Separate the Model Project
- Code sample: Code First Walkthrough: Testing the Model
- Code sample: Code First tour (Silverlight)
- Run the DevForce code generator without the EDM Designer
- Set the generated model namespace
- Stop creating the 'ReadMe' file when (re)generating the Entity Model
- Query code samples
- Display code samples
- Create, modify and delete code samples
- Validation code samples
- Save code samples
- Security code samples
- Test, log and debug code samples
- Configuration and deployment code samples
- Walk through: Use Package/Publish with a DevForce Silverlight application
- Code sample: Add GZip support (Silverlight)
- Code sample: Configure n-tier client communications with WCF
- Code sample: Customize n-tier client configuration in code
- Code sample: Configure EntityServer communications with WCF
- Code sample: Customize EntityServer configuration in code
- Code sample: Config files
- Code sample: Using DataSourceExtensions (Console)
- Code sample: Custom DataSourceKeyResolver (Console)
- Offline code samples
- Additional code samples
- Sample applications
- Punch
- DevForce release notes
- Contact us
- DevForce 2010
Tag Cloud
- Data Binding
- Data Sources
- Design Views
- Validation
- Anonymous
- Architecture
- ASP.NET
- Asynchronous
- Attach
- Azure
- CacheQueryOptions
- Caching
- Closure
- Cocktail
- code first
- Code Generation
- Code Sample
- Concurrency
- Configure
- Cookbook
- Create
- Debug
- Delete
- Deploy
- DevForce 2010
- DevForce Classic
- DevForce-Caliburn framework
- Disconnect
- Discovery
- Display
- Dynamic query
- EDM
- EDMX
- Entity cache
- Entity Framework
- EntityAspect
- EntityCache
- EntityKey
- EntityKeyQuery
- EntityManager
- EntityProperty
- EntityQuery
- EntityQueryOperation
- EntitySaveOperation
- EntityServer
- EntityServerSaveInterceptor
- EntityState
- EntityVersion
- ESQL
- Exception
- Extensibility
- Extension
- Faking
- Fetching
- FetchStrategy
- Getting started
- IIS
- Include
- Interception
- iOS
- IVerifierProvider
- JavaScript
- LINQ
- Localization
- Log
- MEF
- MergeStrategy
- Metadata
- MetadataType
- Model
- Multi-threading
- MVVM
- Navigation
- NET Native
- Object Mapping
- OData
- Offline
- Paging
- Performance
- Persistence
- POCO
- Predicate
- PredicateBuilder
- PredicateDescription
- Prism
- Property Interceptors
- PropertySortSelector
- Push
- Query
- Query cache
- Query Inversion
- QueryStrategy
- Refetch
- Refresh
- Release Notes
- Sample Application
- Save
- SaveOptions
- SaveResult
- SaveStatus
- Saving
- Security
- Serialization
- Silverlight
- Stored Procedure
- Support
- Telerik
- Template
- Test
- ToQuery
- Tour
- Transactions
- Troubleshooting
- UAP
- UWP
- Validation
- Verifier
- VerifierEngine
- Video
- WCF
- Windows 10
- Windows Phone
- Windows Store
- WinForms
- WinRT
- WIP
- WPF
Spaces
This wiki is licensed under a Creative Commons 2.0 license.
XWiki Enterprise 3.2 - Documentation.
Copyright © 2020 IdeaBlade